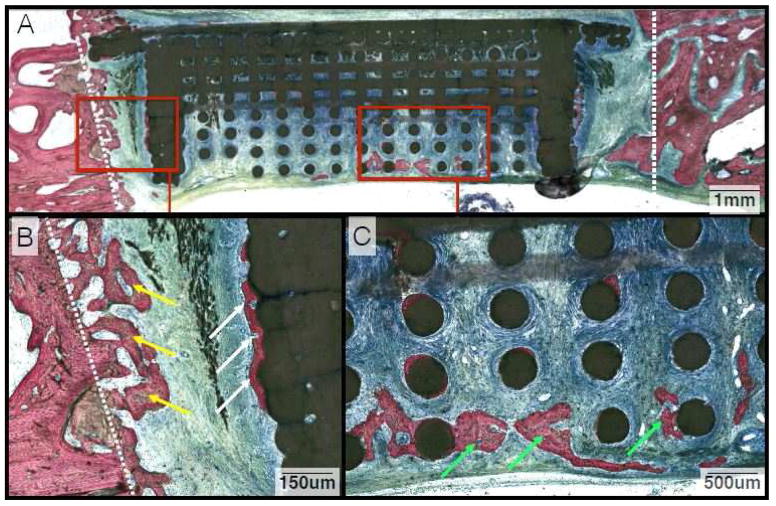
Figure 4.
(A) Representative histologic image from animals in the DIPY group at the 3-week time point. (B) Magnification of bone growth between the osteotomized edge of the defect (Yellow Arrows) and outer wall of the scaffold (White Arrows). (C) Close-up image of bone formation along the inner lattice of the scaffold (Green Arrows). While there is an increase in bone regeneration in the center of the defect relative to controls, it is limited in both groups at this earlier time point.

