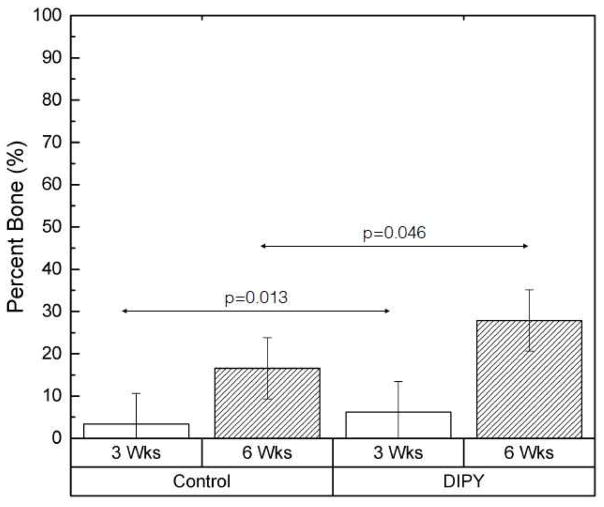
Figure 7.
Graph depicting the percentage of bone formation in each of our groups, averaged across all three methods of analysis (Margins, Outer Core, Inner Core). Samples are grouped by both DIPY or control status and time point. Bars represent means for each group and error bars indicate 95% confidence intervals.

