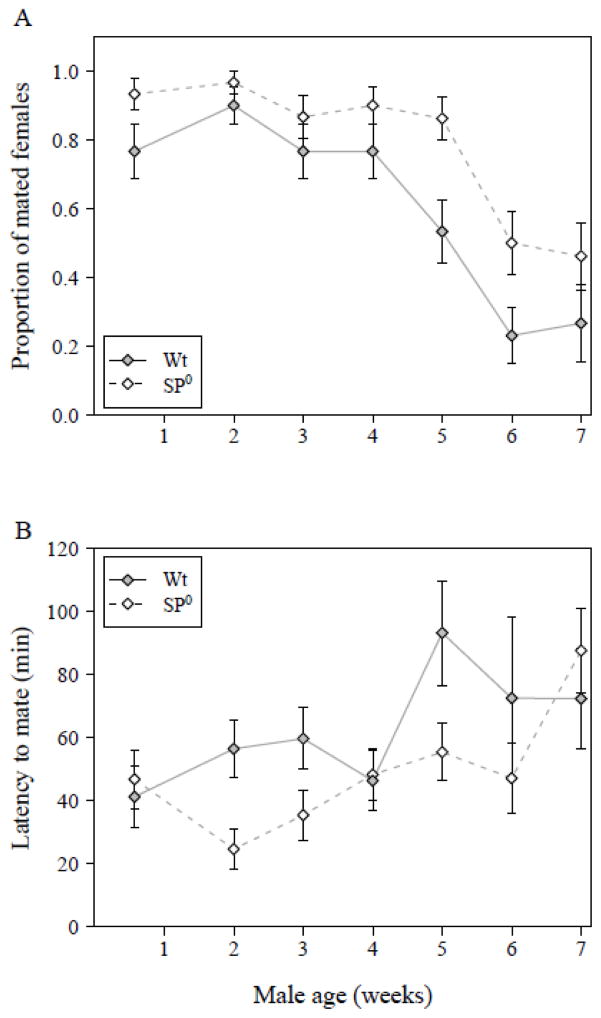
Figure 1.
(A) Mating rate during a 3-hr observation period. The bars show the proportion of 4-day old virgin females that mated to wild-type (filled symbol, solid line) or SP0 (open symbol, hatched line) males of the indicated ages (N = 396). (B). Latency to copulation. The Y-axis shows the minutes between introduction of a female into the mating vial and the start of mating (N = 286). Both figures show means ± SE.

