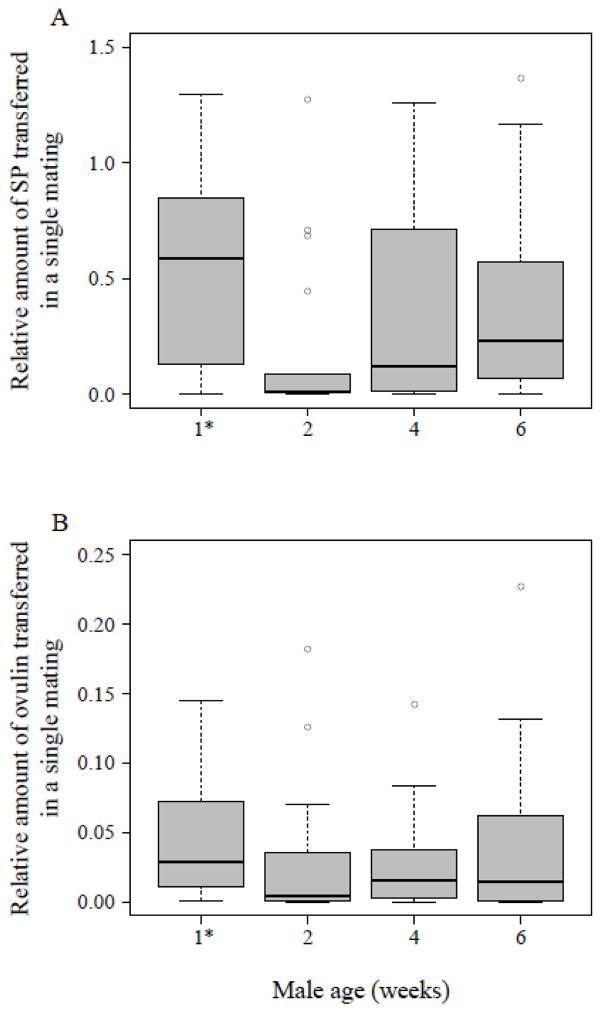
Figure 5.
Relative amounts of (A) SP (N = 68) and (B) ovulin (N = 72) transferred to a female in a single mating by a wild-type male of the indicated age [1* males were four days old]. Females were flash frozen 30 mins after the beginning of the mating and the amount of SP or ovulin within the lower reproductive tract was measured via ELISA, as described in the text. Vertical lines represent the median, boxes the lower and upper quartile, whiskers extend to the extreme values within the 1.5 interquartile range and dots depict outliers outside the 1.5 interquartile range.

