Figure 2.
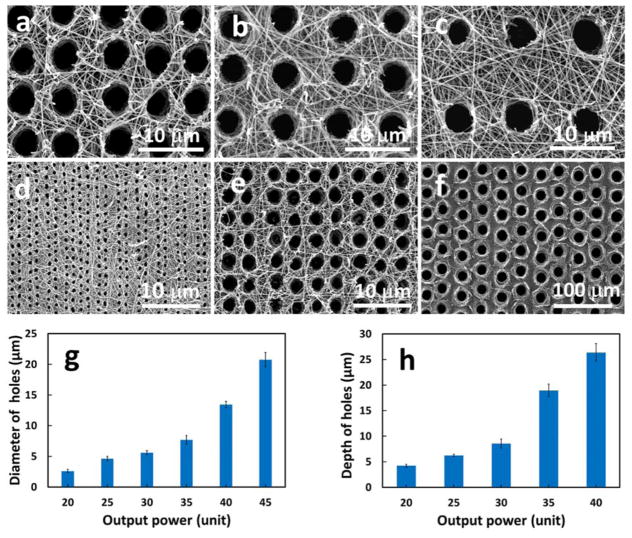
The SEM tubular matrix images with different densities and sizes of the tubules controlled by laser frequency (a) 40Hz, (b) 30 Hz, and (c) 20Hz; and by laser power (d) 20 Unit, (e) 30 Unit, and 45 Unit. (g) The diameter of tubular holes increased with the laser output power. (h) The depth of the tubular holes increased with the laser output power.

