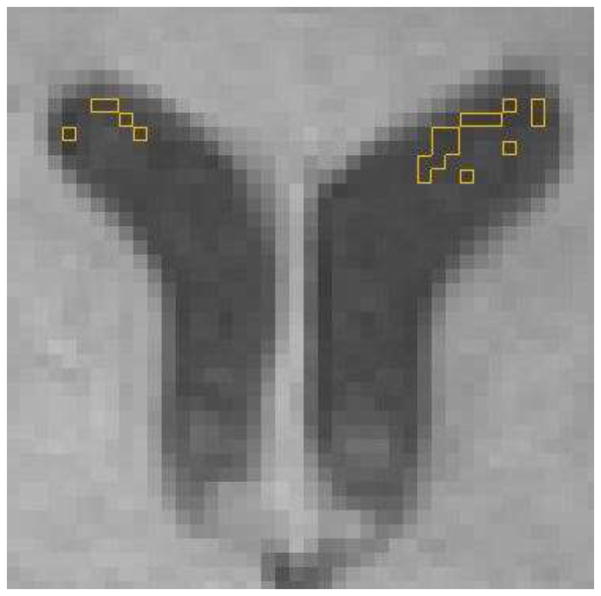
Figure 1. Illustration of determining “baseline intensity”.
The median value for the 20 voxels of lowest intensity (identified by yellow lines) within the lateral ventricles at an axial slice 15mm superior to the initial appearance of the lateral ventricles determined BI. Only voxels that were more than one voxel away from the ventricle edge were used.

