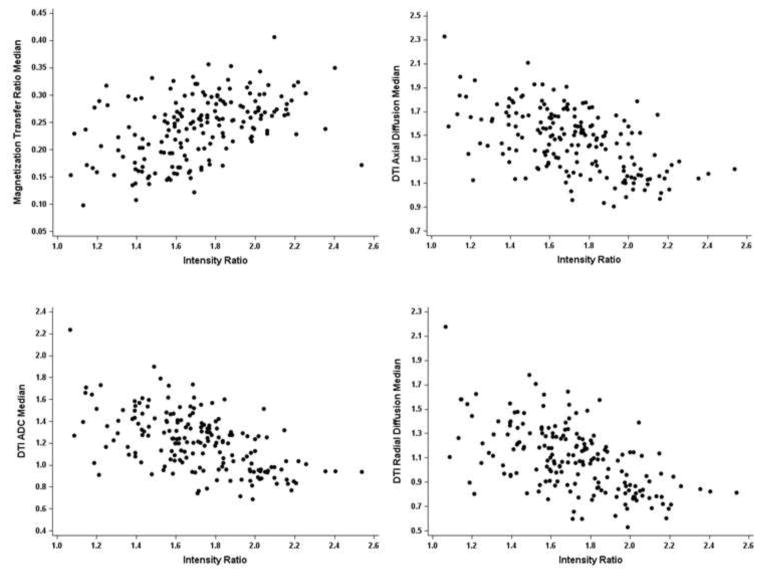
Figure 5. Associations of IR values with MTR and DTI-derived AD, RD, and ADC.
Associations of IR values of PGHs and PBHs with 5a) MTR (R= .473, p=.004), 5b) AD (R= −.515, p < .002), 5c) ADC (R= −.531, p=.001), and 5d) RD (R= −.530, p =.001) are shown. Pearson correlations and linear modeling were used to determine the strength of linear association between IR and each radiological marker. Correlation coefficients are based on the mean values per patient over all lesions to account for clustering.

