
Figure 6.
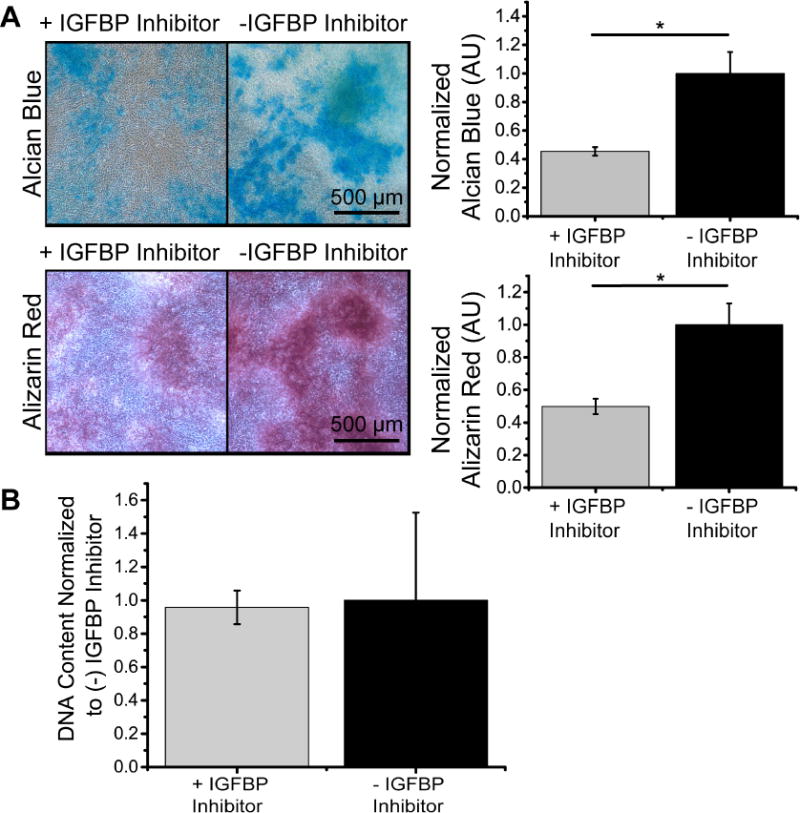
IGFBP inhibitor exhibited decreased cellular differentiation at day 12. (A) Representative images of GAG (alcian blue) and mineral (alizarin red) deposition for groups with and without an IGFBP inhibitor. Graphs show quantification of stain extraction, normalized to (−) IGFBP inhibitor group. (B) Quantification of DNA content for groups with and without IGFBP normalized to the (−) IGFBP group (N=4; Data are means +/− SD; *=significantly different than media only group, p<0.05).