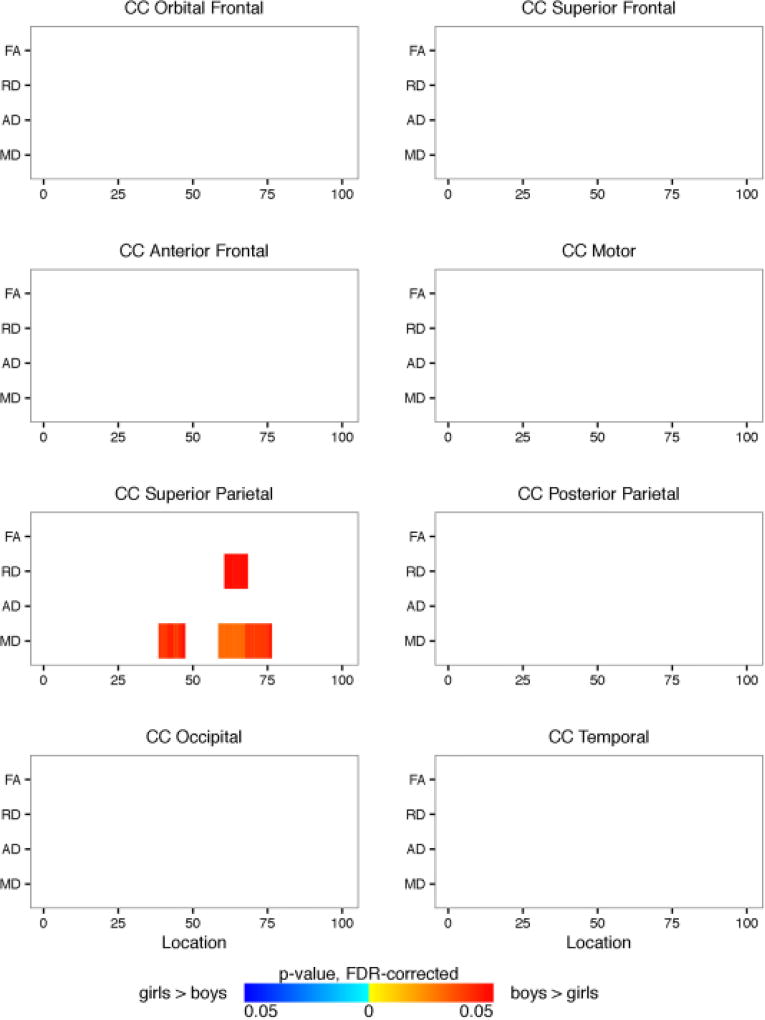
Figure 6.
Shown are the Automated Fiber Quantification (AFQ) summarized results from the 8 corpus callosum segments comparing the girl and boy participants. Plotted is significant p-values (FDR-corrected) for fractional anisotropy and radial, axial, and mean diffusivity (y-axis) along the length of the fiber tract (x-axis). Blue regions represent girls > boys. Red regions represent boys > girls.

