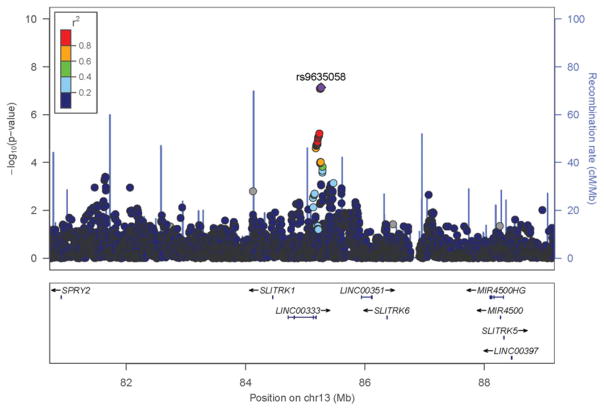
Figure 2.
Regional association plots for SNPs near LINC00333 on chromosome 13. The figure shows −log10 P values for SNPs from the discovery meta-analysis of low-fat dairy interactions. The SNPs shown are within 4000 kb of the index SNP: rs9635058. LD is indicated in color in relation to the highlighted marker. The scheme is red for strong LD, orange for moderately strong LD, green for moderate LD and blue for weak LD. Abbreviations: chr, chromosome; cM, centimorgan; LD, linkage disequilibrium; Mb, mega base pairs; SNP, single-nucleotide polymorphism.

