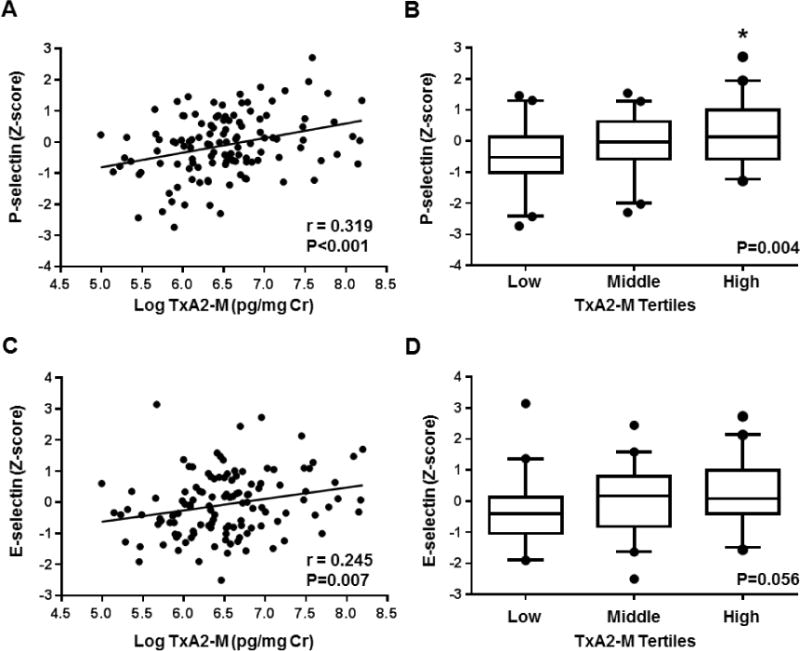
Figure 1. Association between urinary thromboxane metabolite levels and circulating biomarkers of vascular inflammation.

The correlation between urinary TxA2-M levels (log-transformed) and plasma (A) P-selectin and (B) E-selectin levels (z-score) is displayed. The unadjusted Pearson correlation coefficient (r) and corresponding P-value are provided. The distribution of plasma (B) P-selectin and (D) E-selectin levels (z-score) across TxA2-M tertiles is displayed using box plots (low tertile: 147–496 pg/mg Cr, middle tertile: 507–815 pg/mg Cr, high tertile: 818–3,629 pg/mg Cr). Data are presented as median (midline), interquartile range (box), and 95th percentile (whiskers). The ANOVA p-value for the association is provided. *P<0.05 versus the low tertile.
