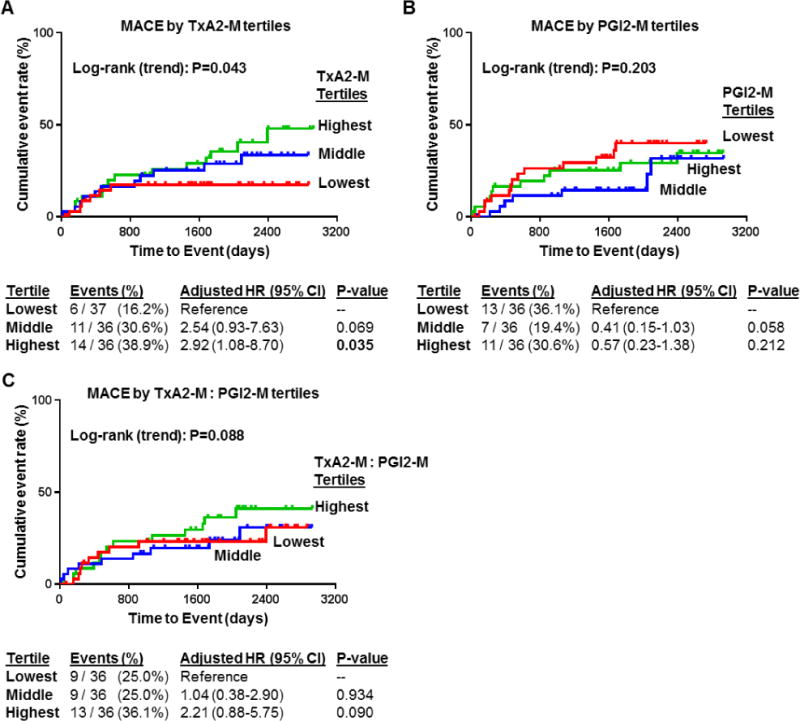
Figure 3. Urinary thromboxane and prostacyclin metabolite levels and risk of subsequent major adverse cardiovascular events (MACE).

Kaplan-Meier curves were generated for incidence of MACE according to tertiles of (A) stable thromboxane metabolite (TxA2-M) levels, (B) stable prostacyclin metabolite (PGI2-M) levels, and (C) the ratio of TxA2-M: PGI2-M in urine at baseline. The log rank P-value for trend across tertiles (adjusted) for each Kaplan-Meier curve is provided. Below the curves, the number and frequency of events within each tertile group, along with the adjusted hazard ratio (HR), 95% confidence interval (CI) and P-value, are provided. Analyses adjusted for demographic (age >65, race, gender) and clinical covariates (diabetes, multivessel disease, aspirin dose).
