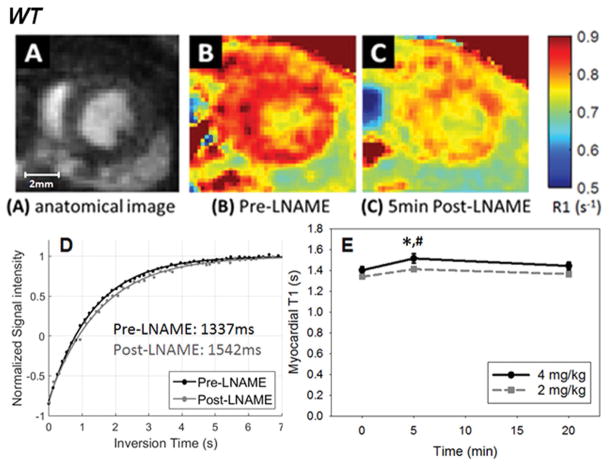
Figure 3.
(A) Example anatomical image used to visualize myocardial borders. R1 maps of the heart acquired before (B) and 5 minutes after injection of 4 mg/kg LNAME (C), demonstrating the decrease in R1 observed in response to NOS inhibition. (D) Example myocardial T1 relaxation curves prior to and 5 minutes after 4 mg/kg LNAME. (E) The time course of myocardial T1 after intravenous injection of LNAME at two doses is shown. Myocardial T1 measured five minutes after 4 mg/kg LNAME injection was higher than at baseline (*P < 0.05) and was higher than 5 minutes after 2mg/kg LNAME (# P < 0.05).

