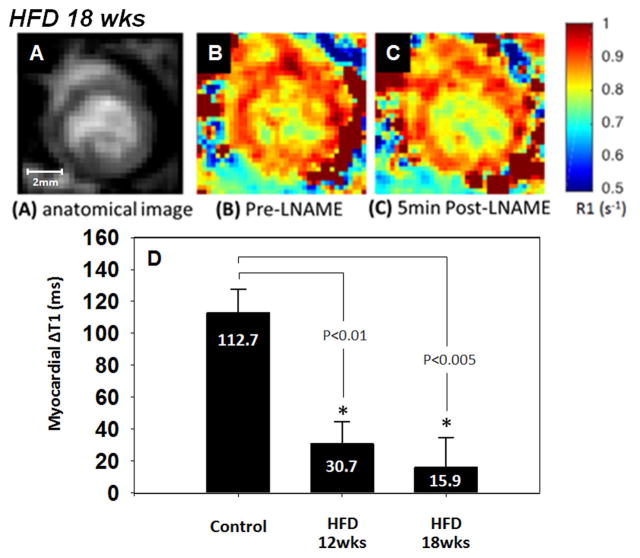
Figure 7.
Anatomical image (A), pre-LNAME R1 map (B), and post-LNAME R1 map (C) of a mouse 18 weeks after initiation of a high fat diet (HFD). One-way ANOVA detected significant differences in the change of myocardial T1 assessed five minutes after LNAME injection between the HFD groups and the control mice fed a standard chow diet (D).

