
Figure 6.
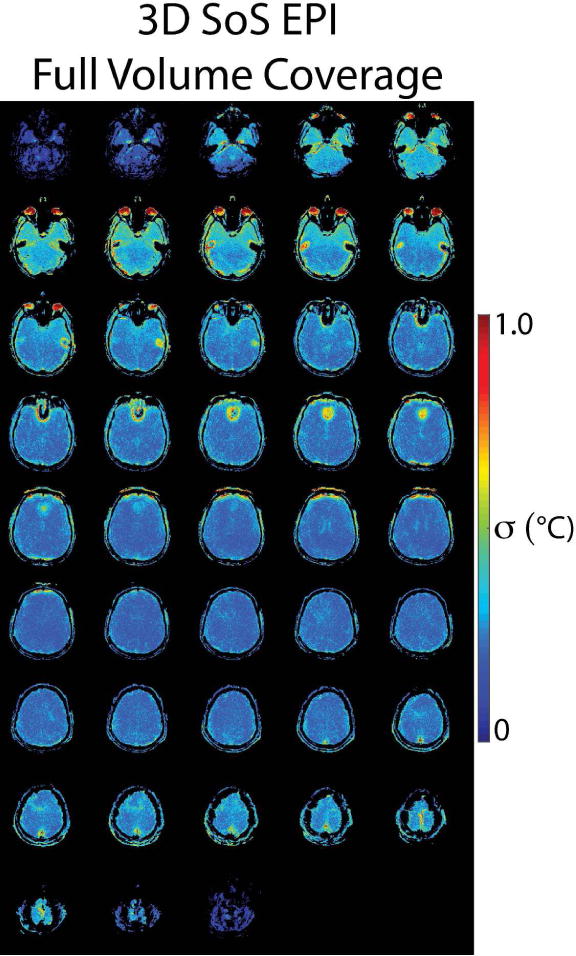
Axial through-time temperature standard deviation maps in one of five volunteers from the 3D SoS EPI sequence, to illustrate the sequence’s overall brain coverage.
Official websites use .gov
A
.gov website belongs to an official
government organization in the United States.
Secure .gov websites use HTTPS
A lock (
) or https:// means you've safely
connected to the .gov website. Share sensitive
information only on official, secure websites.
Axial through-time temperature standard deviation maps in one of five volunteers from the 3D SoS EPI sequence, to illustrate the sequence’s overall brain coverage.