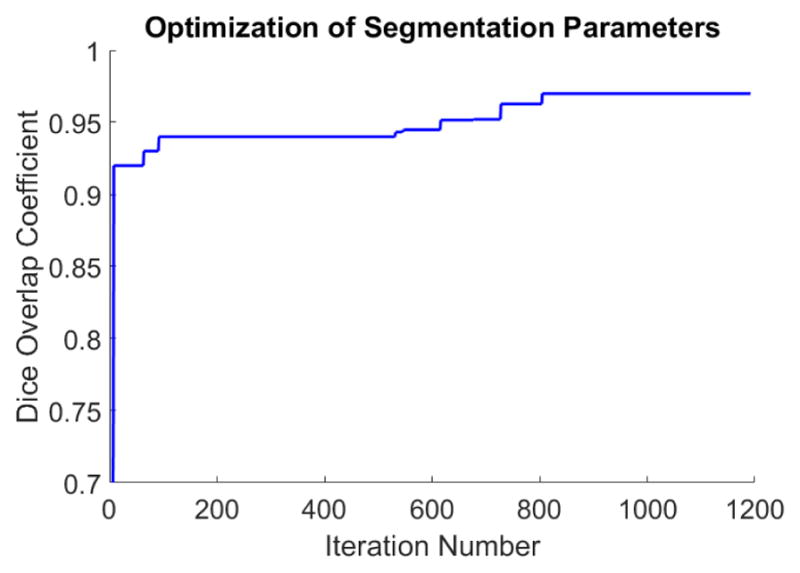
Figure 7.

Optimization of the segmentation parameters using the DE optimization approach is plotted. The Dice overlap coefficient of the training dataset was the objective function used, and is plotted against the iteration number. The blue line represents the cumulative maximum Dice coefficient found so far with a maximum Dice overlap of 96%. These parameters were then used on the training and evaluation dataset.
