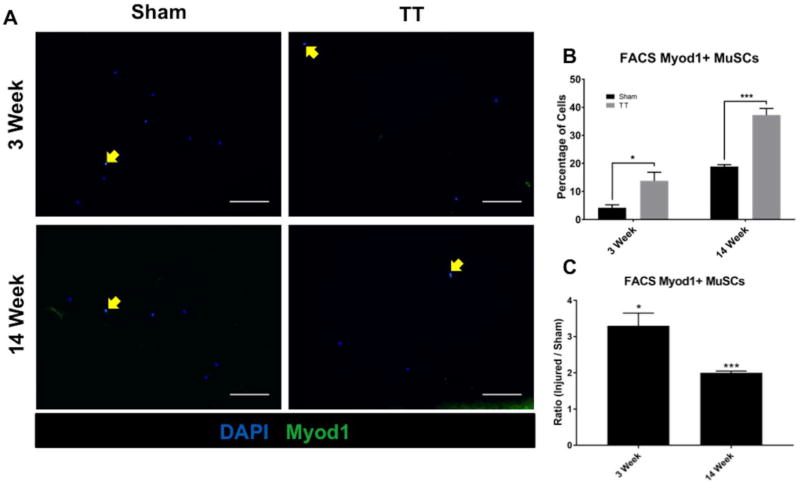
Fig. 4. Quantification of Myod1 positive MuSCs sorted from RC muscle.
(A) Representative immunofluorescence images of MuSCs isolated from sham and TT injured RC muscle at 3 weeks and 14 weeks post-surgery stained with DAPI (blue) and anti-Myod1 antibody (green). Left panels depict MuSCs from sham RC muscle. Right panels depict MuSCs from TT injured RC muscle. Myod1 positive MuSCs are indicated by yellow arrows. Scale bars represent 100µm.
B) Bar graph showing the percentage of Myod1 positive live cells sorted in both TT injured and sham groups. N = 4 were analyzed for each condition depicted. * p < 0.05, ***<0.0005.
(C) Bar graph showing the ratio of Myod1 positive MuSCs in TT injured versus sham experimental groups. N = 4 were analyzed for each condition depicted. * p < 0.05, *** p < 0.0005.

