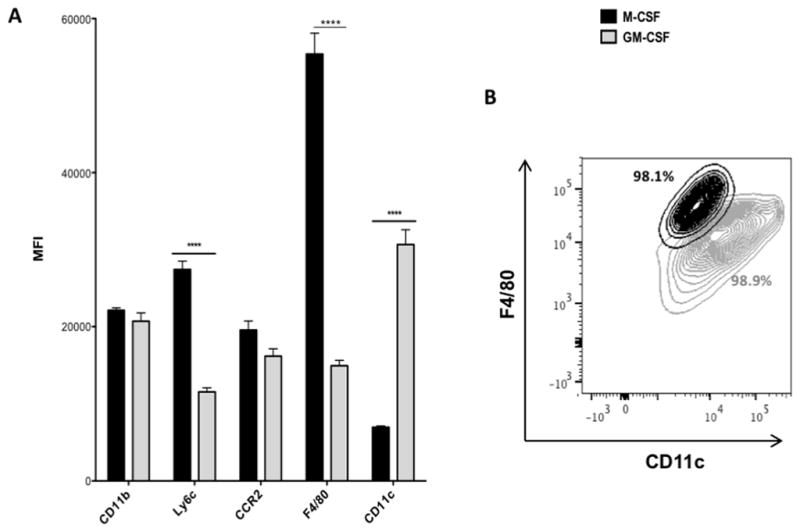
FIGURE 1.

Flow cytometry profile of bone marrow-derived macrophages. Bone marrow-derived macrophages were differentiated in M-CSF or GM-CSF. Cells were labeled with fluorescently-labeled antibodies against CD11b, Ly6c, CCR2, F4/80, and CD11c, and surface expression was detected by flow cytometry. (A) Average MFI levels +/− SEM, ****p <0.0001. (B) Representative scatter plot depicting F4/80 and CD11c profiles of macrophages, including percentages of total cells.
