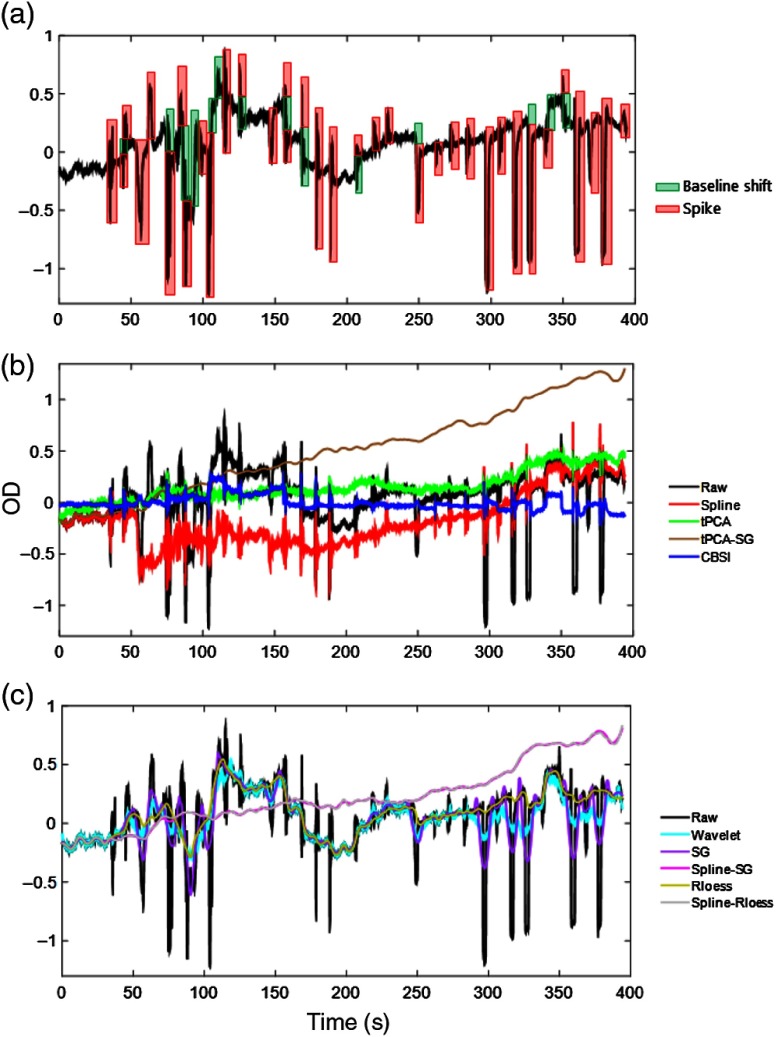
Fig. 4.
(a) OD change at 690 nm from a single channel with no synthetic HRF with baseline shifts (green), high-frequency spikes (pink), zoomed out data (b and c) before correction (black) and after correction by spline (red), tPCA (green), tPCA-SG (brown), wavelet (cyan), CBSI (dark blue), SG (violet), spline-SG (magenta), Rloess (dark gold), and spline-Rloess (silver).

