
Figure 3.
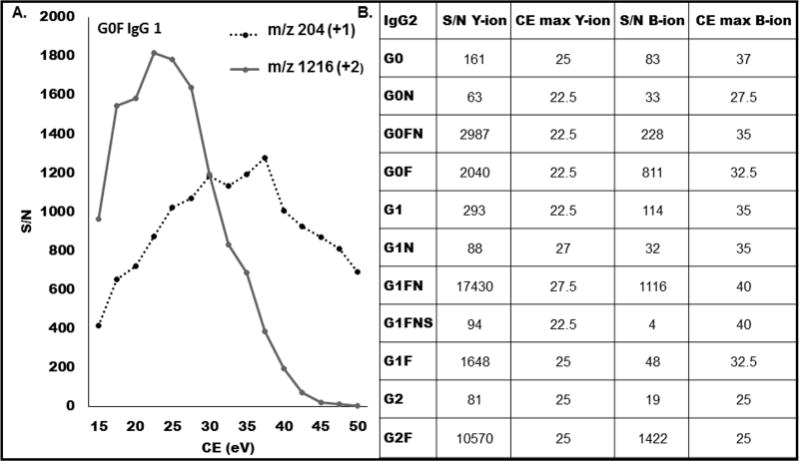
Dependence of the S/N on CE: (A) comparison of the yield of B-ion (204 Da, 1+) with the Y-ion (1216 Da, 2+) of the G0F glycoform of IgG1. The Y-ion was quantified as area of the entire isotopic with SWATH window 5 Da. (B) Table of the S/N of 11 IgG2 glycoforms based on Y- ions or B-ions obtained under CE settings optimal for each fragment.