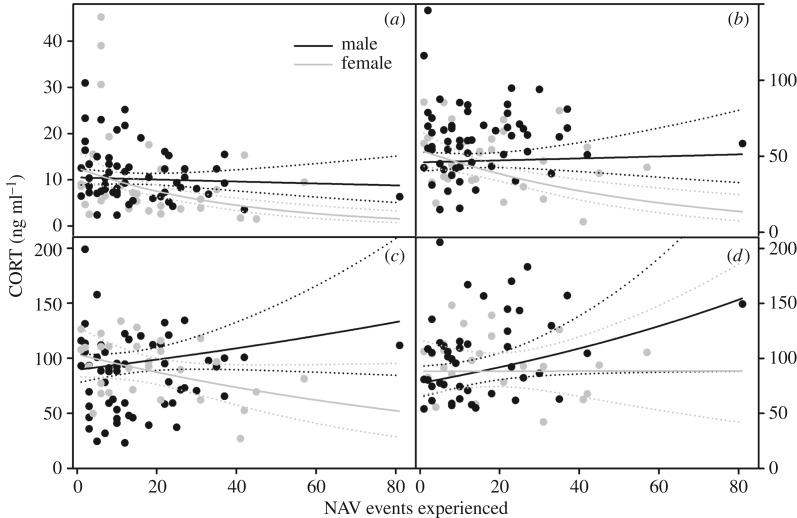
Figure 1.
Sex-specific relationship between NAV victimization and [CORT] (n = 57 males, 30 females) at (a) 0–3, (b) 10, (c) 25 and (d) 40 min post-disturbance. Dots represent individuals, solid lines are regression lines and dotted lines are 95% confidence intervals. Removal of the male with the highest NAV events experienced did not change our results.

