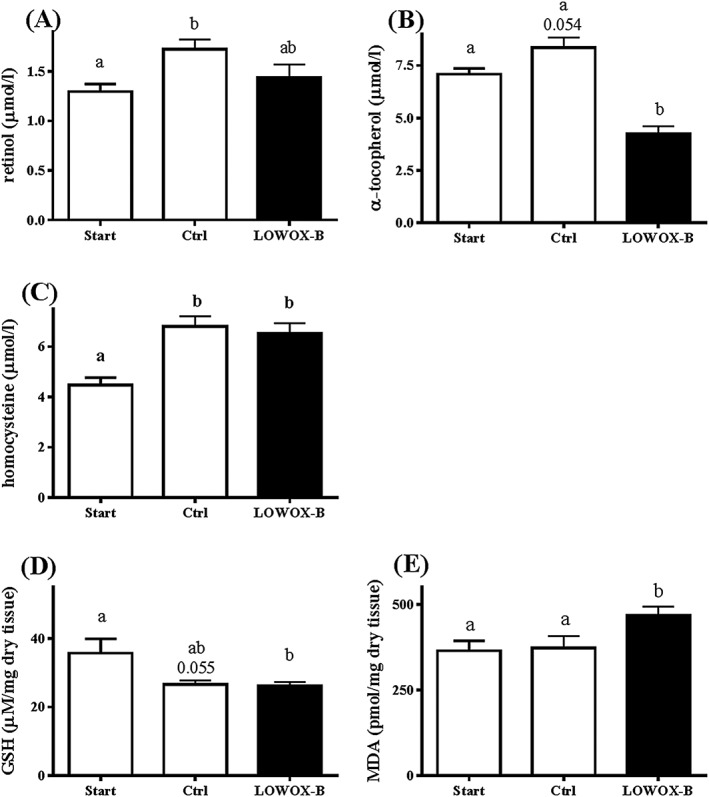
Figure 2.

Biomarkers of nutritional and oxidative status at start (t = 0) and after 4 months of LOWOX‐B diet. (A) Vitamin A plasma levels, (B) homocysteine plasma levels, (C) vitamin E plasma levels, (D) hepatic total GSH levels, and (E) hepatic MDA levels. At start n = 11, ctrl n = 6, and LOWOX‐B n = 10. Different characters indicate statistically significant differences (mixed model with post hoc SIDAK, P < 0.05).
