
Figure 2.
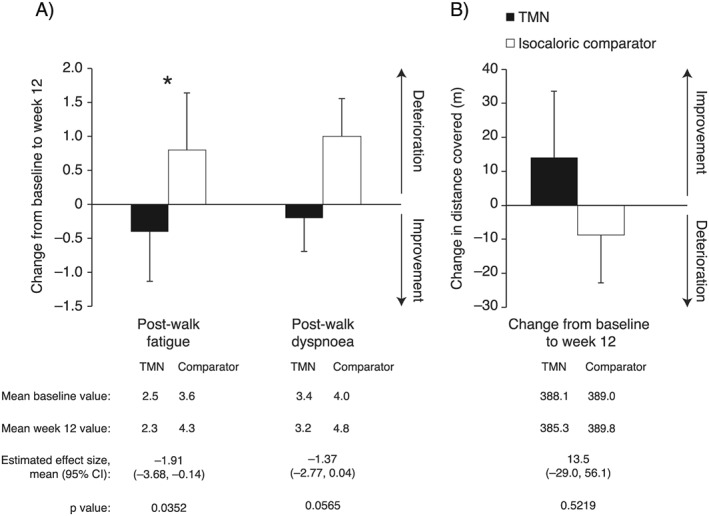
Change from baseline to week 12 in results of the 6 min walk test in the TMN group and the isocaloric comparator group. (A) Borg scale measured post‐walk fatigue and dyspnoea. (B) Distance covered. Data on figures show mean ± SEM change from baseline to week 12, calculated as week 12 value minus baseline value for each patient, divided by the n number; n = 19 for both groups. Data below figures show mean baseline and week 12 values, calculated as the mean of all values recorded. Effect sizes and P values were estimated by analysis of covariance adjusted for baseline value. *P < 0.05 for the TMN vs. isocaloric comparator group. CI, confidence interval; SEM, standard error of the mean; TMN, targeted medical nutrition.