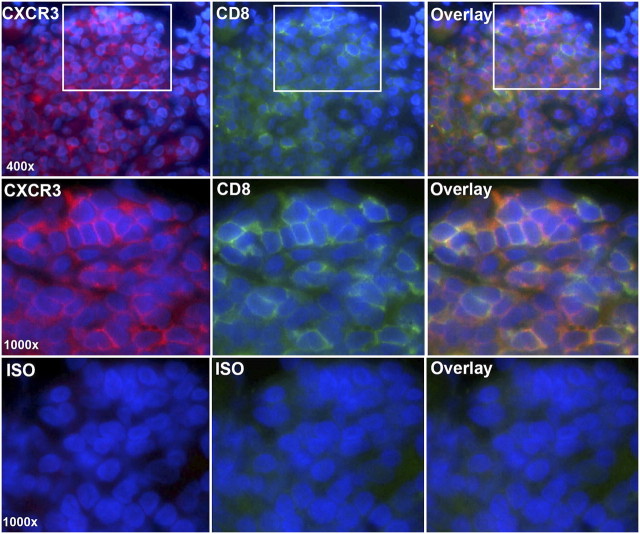
Figure 4.
CXCR3 is expressed by CD8+ T cells. Sections were double-labeled for CXCR3 (Cy5-streptavidin, red) and CD8 (fluorescein-avidin, green). Cell nuclei were stained with DAPI (blue). The top row shows lymphoid follicle cells viewed in the Cy5 channel (red) (left), the FITC channel (green) (middle), or as an overlay of images 1 to 2 (right). The middle row shows insets at higher power. The bottom row shows isotype controls. Original magnification: 400–1,000×.

