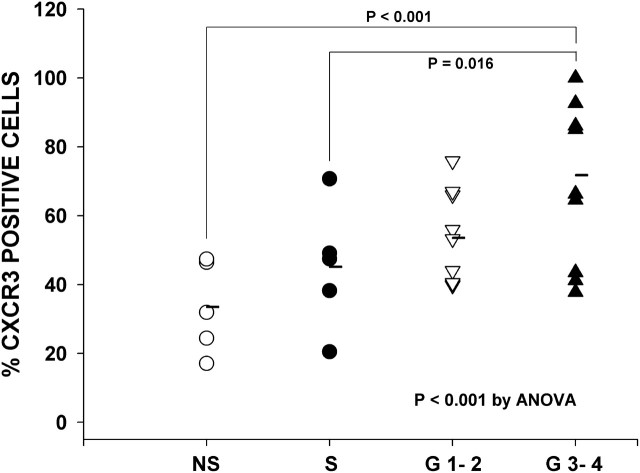
Figure 7.
CXCR3+ cells in lymphoid follicles—individual data. Scatterplot shows the percentage of CXCR3+ follicular cells in individual never-smokers (NS), smokers without chronic obstructive pulmonary disease (COPD) (S), and subjects with COPD in GOLD stages 1 to 4. Horizontal bars show group mean values. The percentage of CXCR3+ cells increased significantly across all groups (P < 0.001) and with increasing COPD severity (P = 0.016 for G3–4 vs. S by post-hoc t test).

