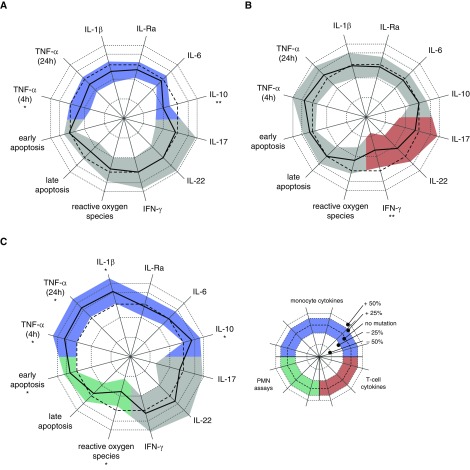
Figure 2.
Response to Mycobacterium tuberculosis strain with or without mutations in the three targets of independent mutation that showed an effect in the primary analysis. Relative differences for individual assays in the secondary analysis are indicated by the difference between the thick black line (mutation present) and the thin reference line (no mutation) for each of the following targets of independent mutation that significantly influenced at least one assay group: (A) espE, (B) PE-PGRS56, or (C) Rv2813–2814c. Shaded area represents the 95% confidence interval, corrected for the fact that five genes or intergenic regions were tested for each assay. *P < 0.05/5 = 0.01. **Significant after further correcting for number of assays per group (i.e., 0.05/[5 × 6] for monocyte cytokines and P < 0.05/[5 × 3] for T-cell cytokines and polymorphonuclear neutrophil [PMN] assays). Significance in the primary analysis is indicated by a colored confidence interval for monocyte cytokines (blue), T-cell cytokines (red), and PMN assays (green). TNF = tumor necrosis factor.

