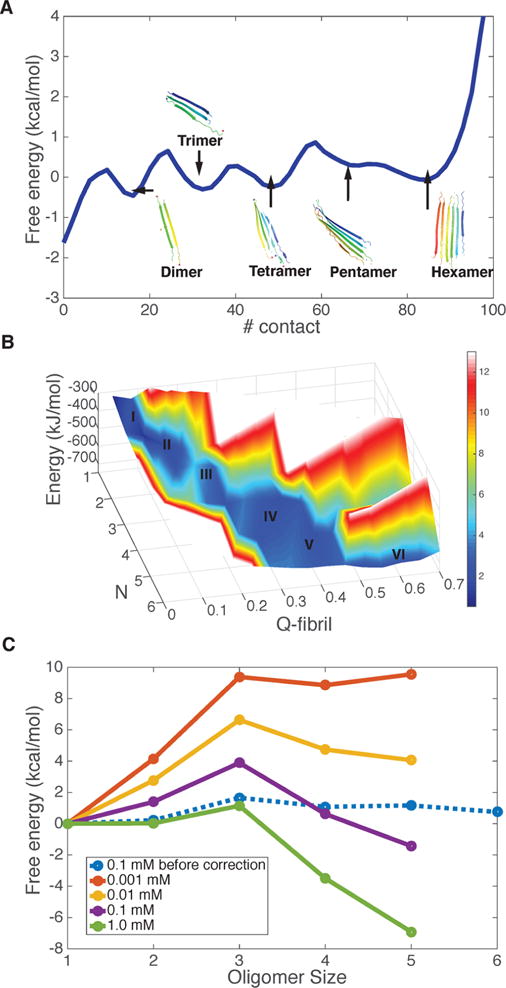
Figure 2.

Aggregation free energy landscape for Q20 at 300 K. (A) The free energy profile as a function of the number of total residue–residue contacts in the simulation system with six Q20 peptide chains. Representative structures of different oligomers are shown in each free energy basin of the progress in different oligomeric states. (B) The energy and free energy surfaces for aggregation of Q20 are plotted as a function of the oligomer size (N), along with its structure similarity compared to the final fiber form (Qfibril). The z-axis is the energy of the system, which decreases monotonically as the oligomer size increases. The color indicates the free energy. The local basins for different oligomer states are labeled by size. A free energy barrier occurs around N = 3. (C) The grand canonical free energy for different oligomer states as corrected for concentration changes shows the saturation value of the concentration of free monomers.
