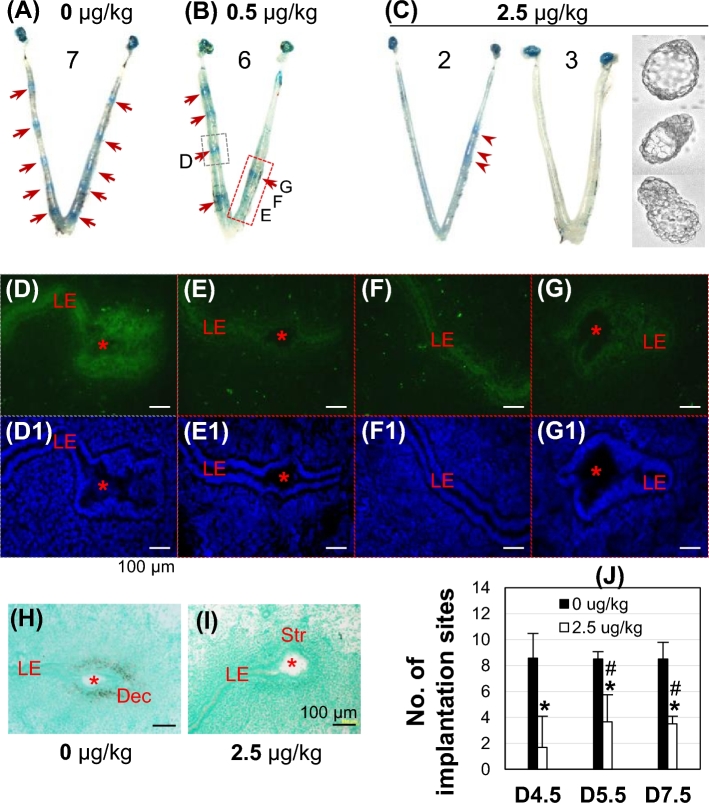
Figure 5.
Effects of V-ATPase inhibitor bafilomycin A1 on embryo implantation and uterine epithelial acidification in WT mice. (A–C) Representative uterine images from 0 (A), 0.5 (B), and 2.5 μg/kg (C) bafilomycin A1-treated groups detected on D4.5. Red arrow, defined implantation site; red arrowhead, delayed implantation site; 7, 6, 2, 3, numbers of mice in each condition/group. Embryos in C flushed from the uterine horns without implantation sites. Bafilomycin A1 was injected into uterine fat pad on the right uterine horn on D3 at 18:00 h, 4–6 h before implantation initiation [49]. (D–G) LysoSensor Green DND-189 staining of the implantation site indicated by the gray rectangle (D) and the approximate uterine segments in the red rectangle (no blue dye reaction in the uterine segments for E and F and a clear implantation site for G) in B. (D1–G1) DAPI staining of the sections in D–G, respectively. (H, I) In situ hybridization of decidualization marker Abp1 in an implantation site from A (H) and a faint implantation site in C (I). (D–I) Red star, embryo; LE, uterine luminal epithelium; Str, stroma; Dec, decidual zone; scale bar, 100 μm. (J) Number of implantation sites in vehicle and 2.5 μg/kg bafilomycin A1-treated groups detected on D4.5, D5.5, and D7.5. Error bar, standard deviation; *P < 0.05, compared to vehicle-treated group; #P < 0.05 compared to bafilomycin A1-treated group on D4.5; N = 3–7.

