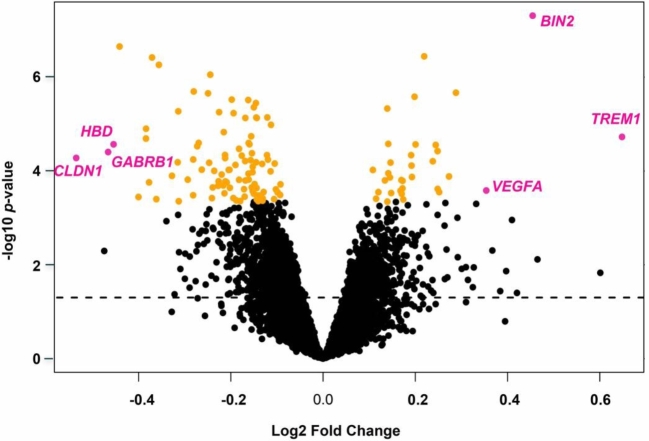
Figure 2.
Results of the LIMMA analysis on the aggregated data set adjusted for fetal sex as a confounding variable. The dotted line represents unadjusted P < 0.05. Significant samples adjusted for multiple comparisons by the Benjamini–Hochberg correction P < 0.05 are shaded in orange. The six most differentially expressed genes selected by fold-change are shaded in magenta.

