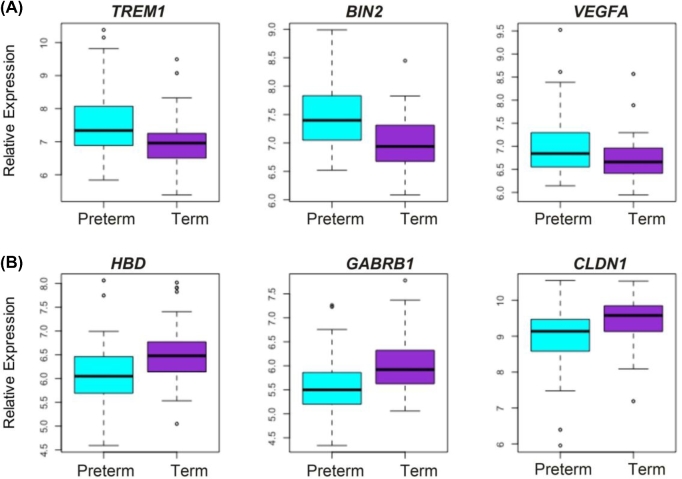
Figure 3.
The six top differentially regulated genes in preterm placentae vs term placentae. Boxplots of the top three genes with the greatest positive and negative log/fold changes. Expression of preterm samples (n = 55) is shown in blue, and expression of term samples (n = 78) is shown in purple. (A) TREM1, BIN2, and VEGFA are all upregulated in preterm placentae compared to term. (B) HBD, GABRB1, and CLDN1 are all downregulated in preterm placentae compared to term.

