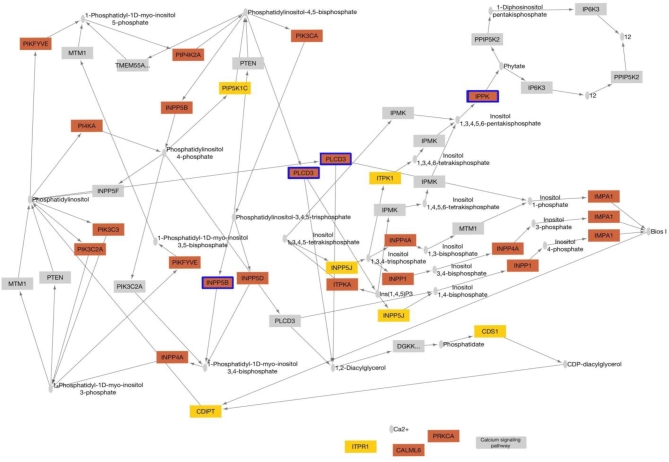
Figure 6.
KEGG diagram of the phosphatidylinositol signaling network. Genes overexpressed in preterm birth placentae are orange, and downregulated genes are yellow. Genes with statistically significant changes in expression based on rank (P < 0.05, t-test, Small grey ovals represent molecules or chemical compounds. Arrows indicate molecular interactions.) are outlined in blue.

