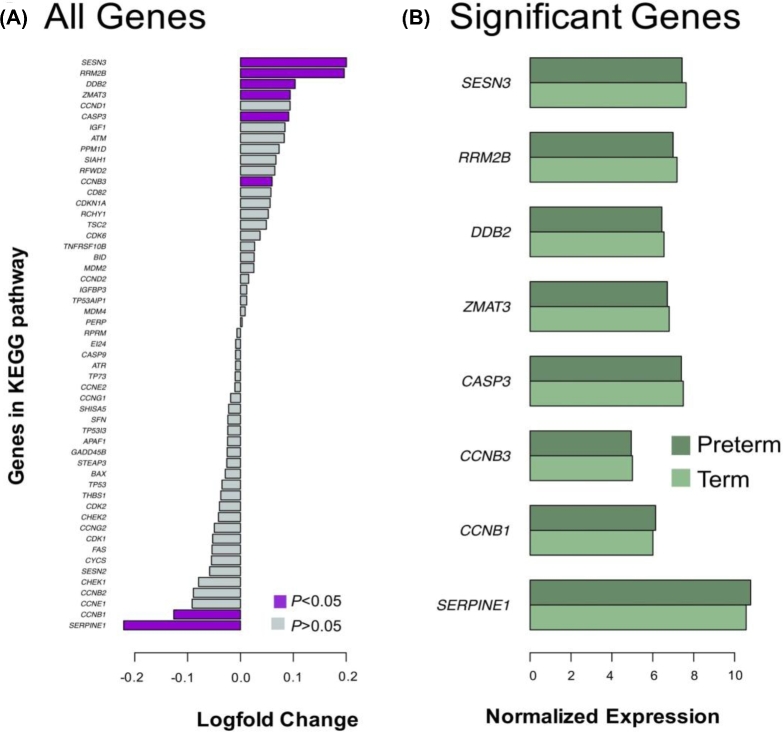
Figure 7.
Differentially expressed genes in P53 signaling network. (A) Changes in expression between preterm and term placentae for each of 53 genes in network. Genes considered statistically different (P < 0.05, t-test) are purple. Nonsignificant genes are gray. (B) Average expression of statistically significant genes from panel A. Preterm placentae are shaded dark green and term placentae are shaded in light green.

