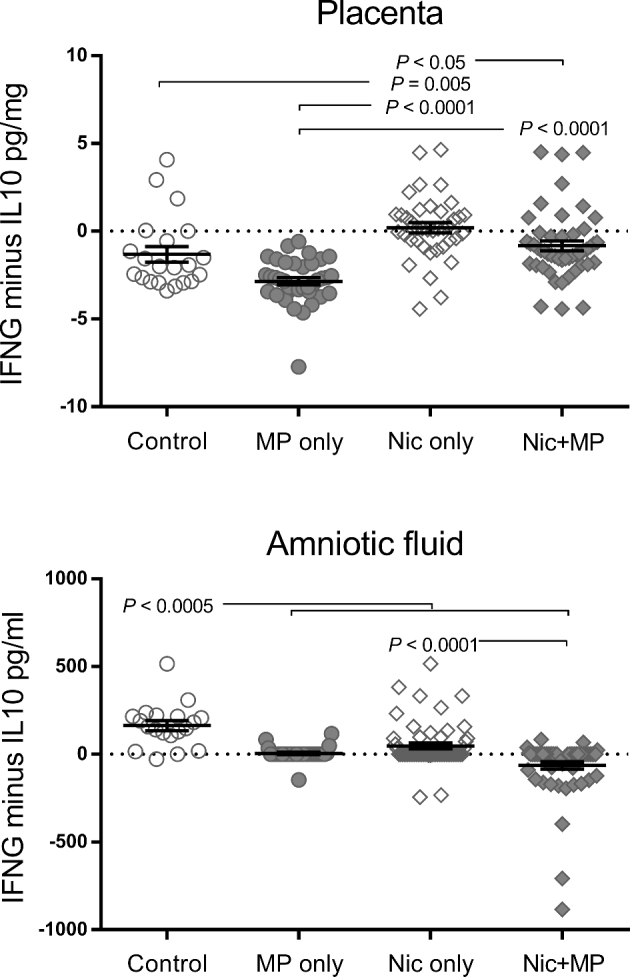
Figure 10.

The normal environments of the placenta (M2/Th2) and amniotic fluid (M1/Th1) are impacted by nicotine, alone or in concert with infection. As an indicator of the overall M2/Th2 profile in individual placenta and amniotic fluid samples, the IL10 level was subtracted from the IFNG level. A negative value was indicative of a more M2/Th2, IL10-dominant environment; positive values were indicative of a more M1/Th1, IFNG-dominant environment, and values near zero indicated a neutral environment. Cytokine data for control (n = 21), Nic only (n = 39), MP only (n = 38), and Nic + MP (n = 49) placentas, and for control (n = 12), Nic only (n = 57), MP only (n = 30) and Nic + MP (n = 58) amniotic fluids, were analyzed by the Kruskal-Wallis test. P values < 0.05 indicate significant differences between groups. Graphs show individual data points as well as bars for mean and SEM.
