
Figure 5. Systemic kynurenine decreases evoked glutamate levels in the PFC.
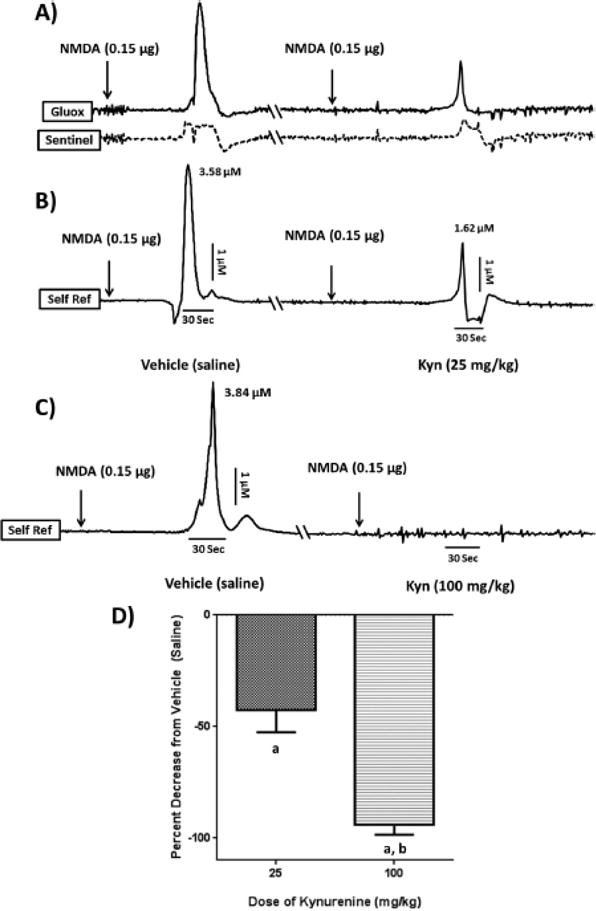
Each set of representative tracings (panels A–C) was recorded from the PFC of the same intact animal following an infusion of NMDA (0.15 μg in 0.5 μL) into the NAcSh 2 hrs after a systemic injection of either vehicle or kynurenine. Each tracing is separated by at least 24 hrs (cut \\ in the axis), and baselines are displayed uniformly for ease of comparison (see text for actual values). The vertical dimension represents changes in concentration (μM), whereas the horizontal dimension reflects the passage of time (sec). The timing of NMDA infusions relative to the glutamate peaks are indicated by arrows. (A): The solid-line tracing represents the signal from the glutamate-sensitive channel (Gluox), whereas the dashed tracing represents the signal from its adjacent sentinel channel; (B/C): Self-referenced (Self Ref) signals derived from subtracting the sentinel channel from the Gluox channel, thereby isolating the signal obtained exclusively from the oxidation of extracellular glutamate. NMDA causes a robust increase in PFC glutamate, which is attenuated after an injection of 25 mg/kg kynurenine (i.p.) (B) and essentially abolished after an injection of 100 mg/kg kynurenine (i.p.) (C); (D): Group data (n = 6/ group). a P < 0.05 vs. vehicle; b P < 0.05 vs. 25 mg/kg kynurenine.