
Figure 2.
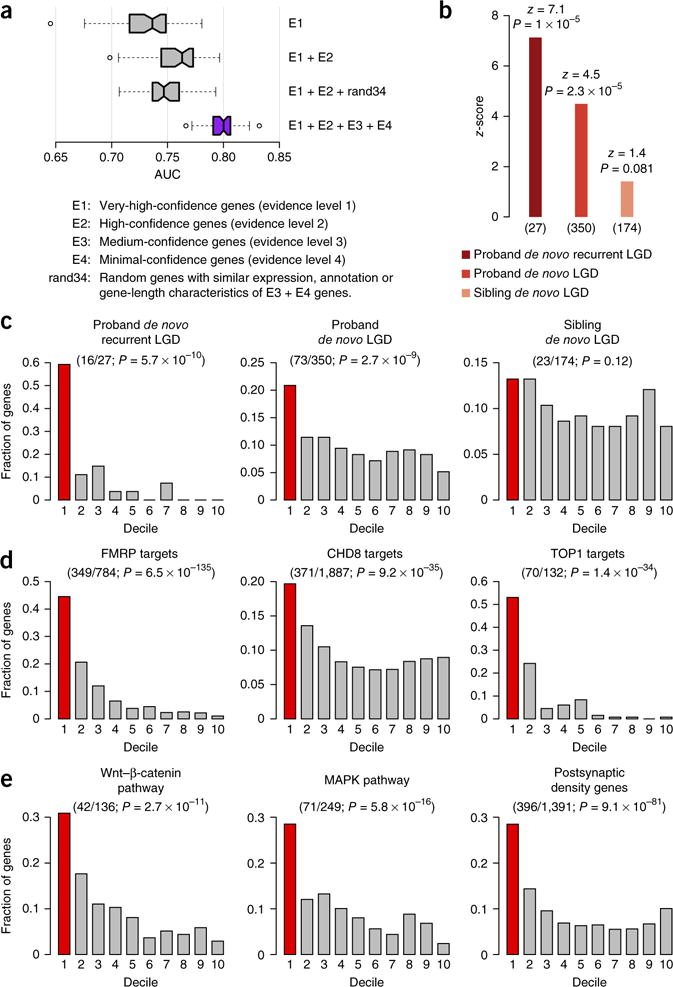
Evaluation of autism-associated gene predictions. (a) Performance of autism-associated gene prediction with different training gold standards. Each boxplot corresponds to the distribution of the AUC obtained from 50 evaluations (10× five-fold cross-validation; ends and center line: 25th, 50th and 75th percentiles of AUC, respectively; notches: 95% confidence interval around the median; whiskers: 1.5× interquartile range above and below the 25th and 75th percentiles; dots: outliers). Evidence-weighted classifier (purple) significantly outperforms all the other classifiers (Wilcoxon rank-sum test, U ≥ 2,399, P ≤ 1 × 10⁻¹⁴). (b) Rank-based enrichment of three gene sets from an independent sequencing study7 toward the top of our genome-wide ASD gene-ranking (summarized as z-scores; number of genes (n) given below; Online Methods). Enrichment P-values atop each bar were calculated using a permutation test (Online Methods). (c–e) Evaluation of the overlap of mutation and functional gene sets within the first decile (top 10%) of our predictions (one-sided binomial test). Fractions of genes in the gene set (y axis) that occurred within each decile of the genome-wide ranking (x axis; first decile colored red; number of genes in top decile/total and enrichment P-value in parentheses). (c) Decile enrichments of mutation data (used in b) were consistent with the trend observed in rank-based tests (in b). (d) Experimentally determined targets of the major ASD-associated regulatory proteins FMRP, CHD8 and TOP1 were significantly enriched among the top-decile predictions. (e) Members of major ASD-associated pathways and complexes (Wnt signaling, MAPK signaling, and the postsynaptic density complex) showed similar significant enrichments.