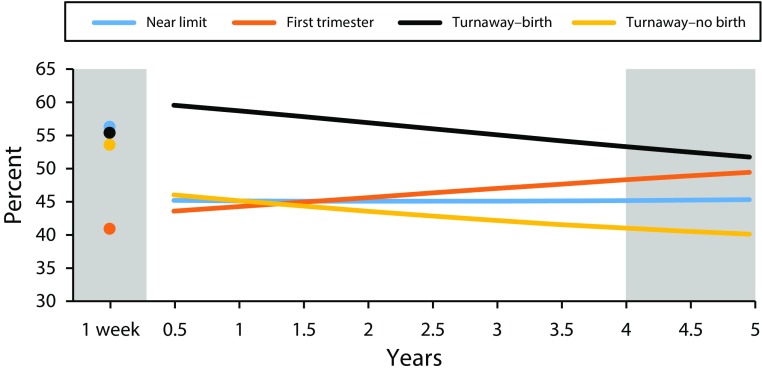
FIGURE 1—
Trends in Household Poverty for 5 Years After Receipt or Denial of Abortion: United States, 2008–2016
Note. Model adjusted for baseline age, parity, household structure, and the baseline value of household poverty. One-week values are given for reference. Remaining outcomes can be found in Appendix B, available as a supplement to the online version of this article at http://www.ajph.org. Unshaded areas represent time periods in which the turnaway–birth group are significantly different (P < .05, based on a postestimation test) from the near-limit abortion group.

