Graph 2.

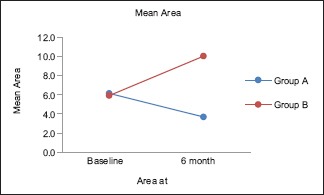
Graph showing the comparison of the total area of the papillary defect in Group A and Group B at baseline and 6 months postsurgery

Graph showing the comparison of the total area of the papillary defect in Group A and Group B at baseline and 6 months postsurgery