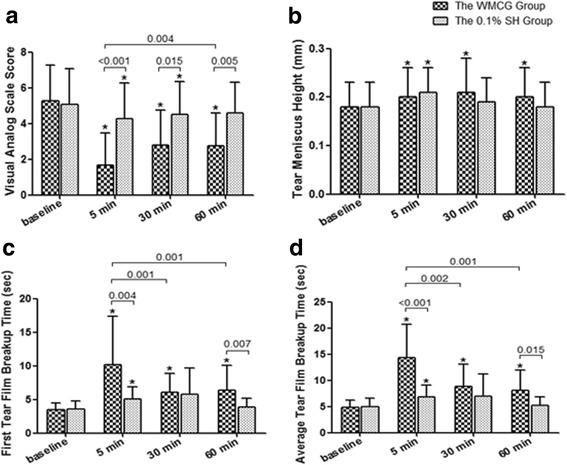
Fig. 2.

The changes of VAS, TMH, FBUT and ABUT after treatment in the WMCGs and the 0.1% SH groups. The VAS (a), TMH (b), FBUT (c) and ABUT (d) improved significantly across 60 min after wearing goggles for 15 mins (P ≤ 0.012); however the improvement only existed for these parameters at 5 min after 0.1% SH application in the control group (P ≤ 0.011), as well as for VAS at 30 min (P = 0.017). The difference bwtween the two groups was significant for VAS across 60 min (P ≤ 0.015), for FBUT and ABUT at 5 min and 60 min (P ≤ 0.015), but bot for TMH (P ≥ 0.341). * Self-comparison (post-treatment values compared with baseline level) by paired t test with Bonferroni correction (P < 0.05)
