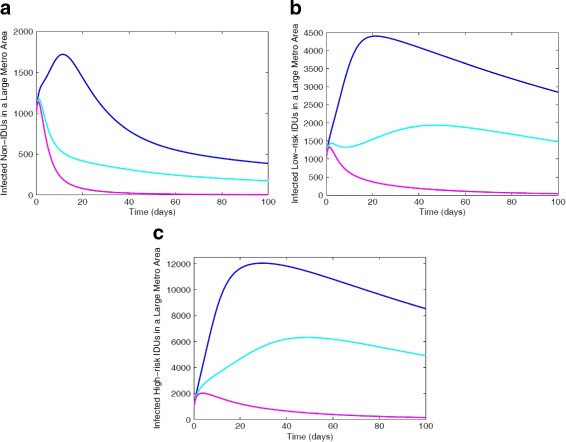
Fig. 10.

Simulation of the MRSA model (1) with IDUs showing the various effectiveness control strategies for total number of infected in each of the different subgroups: a Non-IDUs; b Low-risk IDUs; c High-risk IDUs. Parameter values used are as given in Tables 6 and 7. Blue lines correspond to low-effectiveness strategy, turquoise blue represent moderate-effectiveness strategy and magenta represent the high-effectiveness strategy
