Fig. 2.

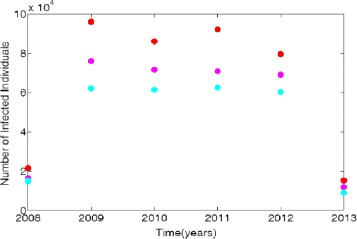
Demographic data from three regional areas, large metro, large suburb, and rural. Red dots represent large metro areas, magenta correspond to the large suburb areas and turquoises blue represent the data for rural areas

Demographic data from three regional areas, large metro, large suburb, and rural. Red dots represent large metro areas, magenta correspond to the large suburb areas and turquoises blue represent the data for rural areas