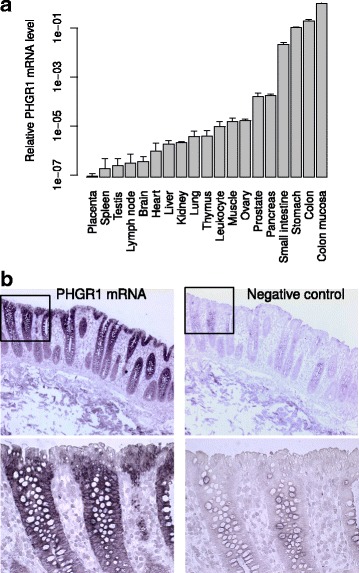
Fig. 2.

PHGR1 mRNA characterization. a PHGR1 mRNA levels in various tissues presented relative to a reference mRNA and the pooled colon mucosa samples. The error bars represent the standard deviation from three independent experiments. b In situ hybridization of PHGR1 mRNA in the colon wall. The left panels show 10× and 40× (insert) microscopy images of a tissue section hybridized to PHGR1-specific probes. The right panels show corresponding images of an adjacent tissue section hybridized to a negative control probe. Nuclear counterstaining (blue) was achieved with hematoxylin
