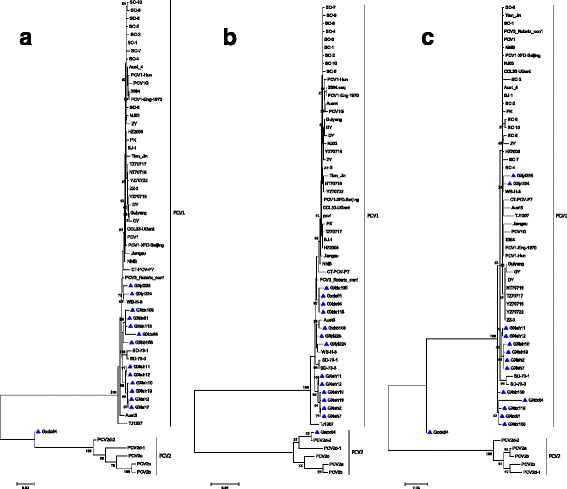
Fig. 2.

Phylogenetic tree analysis based on the nucleotide sequences of the complete genome (a), cap gene (b), and rep gene (c), performed using the ML method. Numbers along the branches indicate the percentage of confidence in the ML analysis. Only bootstrap support values of >50% are indicated. PCV1 strains isolated in this study are denoted by triangle (▲)
