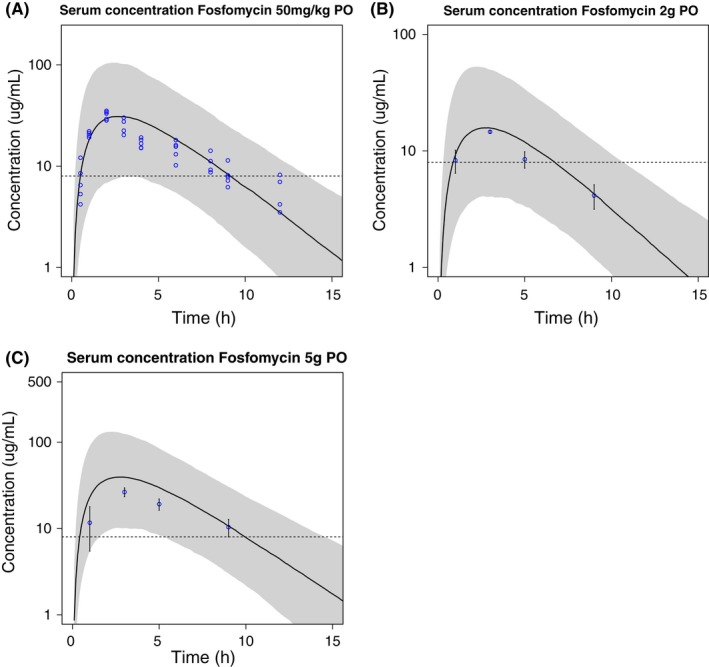
Figure 3.

Mean serum fosfomycin concentration‐time profiles (black line) and 90% prediction interval (gray area) of 1000 simulated subjects with reported observations24 after oral administration of fosfomycin tromethamine: (A) 50 mg/kg with data (blue circles,24 (B) 2 g with reported mean values ± SD and (C) 5 g with reported mean values ± SD. The dashed line represents the minimum inhibitory concentration
