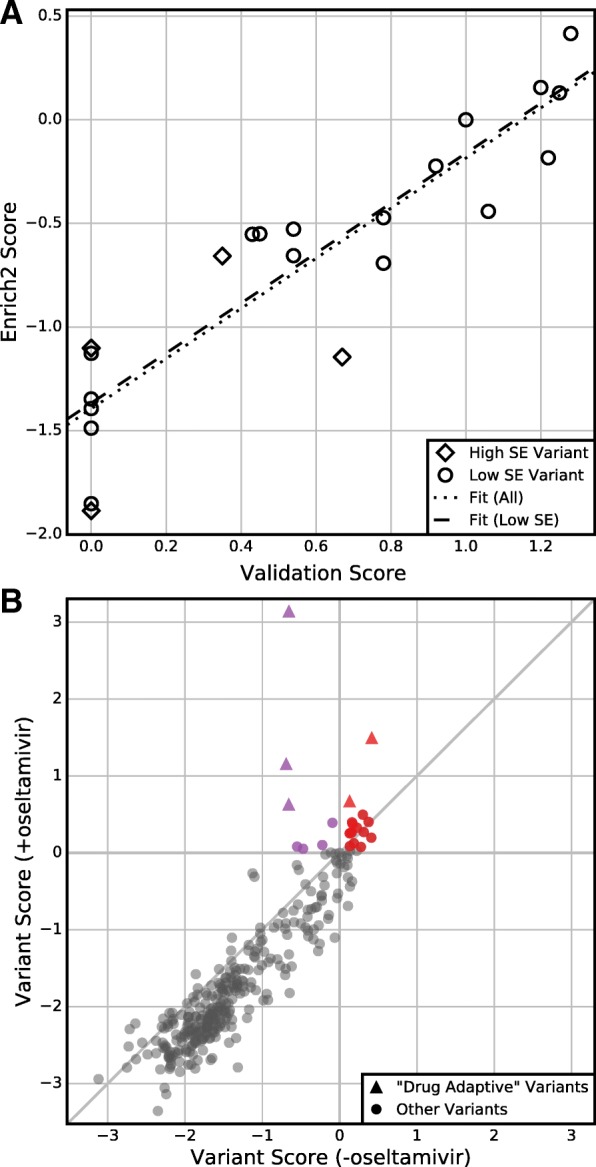
Fig. 6.

Standard errors enable hypothesis testing. a Enrich2 variant scores are plotted against single-variant growth assay scores for the 22 individually validated variants of the neuraminidase dataset. Four (18%) of these variants have Enrich2 standard errors larger than the median standard error. The dotted line shows the best linear fit for all variants and the dashed line shows the best linear fit for variants with standard errors less than the median. b Enrich2 variant scores are plotted for selections performed in the presence or absence of the small molecule inhibitor oseltamivir. Colored points indicate variants that significantly outperformed wild-type in the drug’s presence. Red points also scored significantly higher than wild-type in the drug’s absence. Triangles indicate the five “drug-adaptive” mutations identified originally [3]
