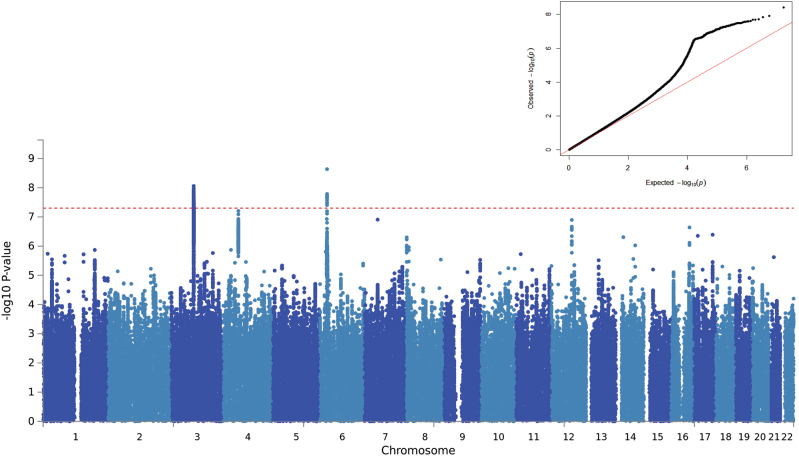
Fig. 1.
Results of a genome-wide association study of self-reported risk-taking behaviour (1000 Genome imputation). SNPs are plotted along the X axis by chromosome and position, with strength of association with self-reported risk-taking behaviour plotted on the Y axis. The red line indicates the threshold for GWAS significance (p ≤ 5e−8). Inset: QQ plot demonstrates deviation from null expectation (solid red line) of the GWAS results (black data points)

