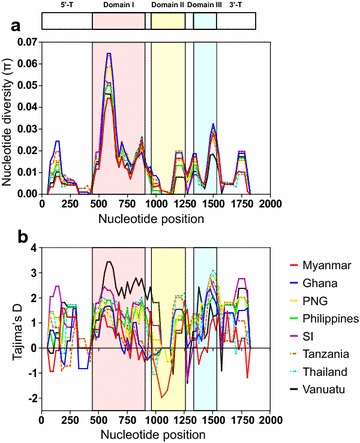
Fig. 4.

Nucleotide diversity and natural selection of global PfAMA-1. a Nucleotide diversity. Sliding window plot analysis showed nucleotide diversity (π) values across global PfAMA-1 sequences analysed. A window size of 100 bp and a step size of 25 bp were used. b Natural selection. Sliding window calculation of Tajima’s D statistic was performed for global PfAMA-1. A window size of 100 and a step size of 25 were used. Myanmar, red line; Ghana, blue line; Papua New Guinea (PNG), yellow line; Philippines, green line; Solomon Islands (SI), purple; Tanzania, dotted red line; Thailand, dotted blue line; and Vanuatu, black line
