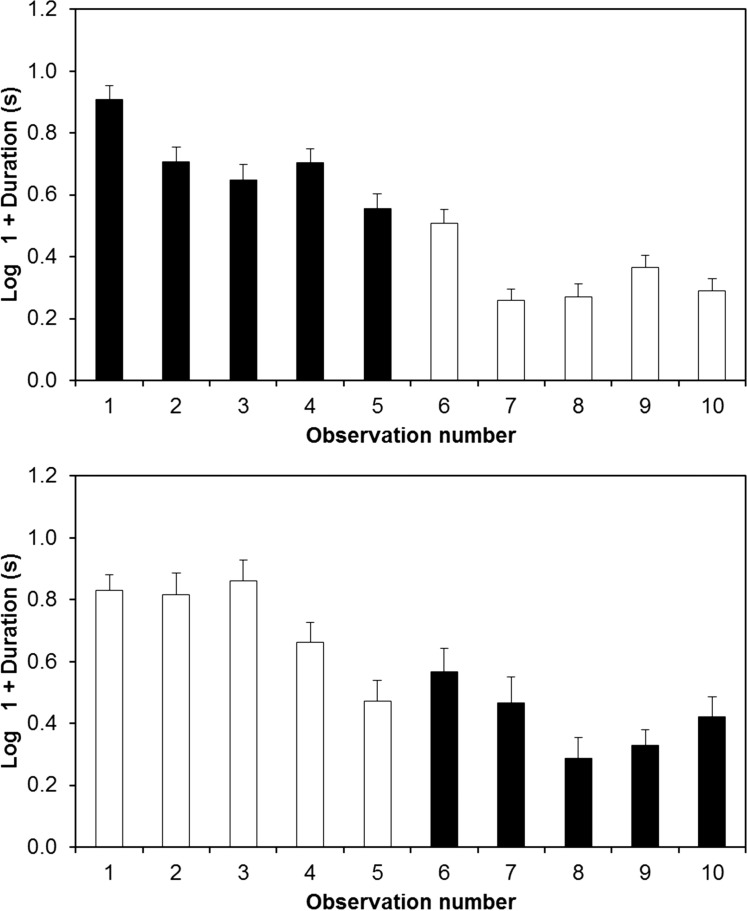
Figure 1.
Mean startle response durations. There was a significant interaction between treatment order (high to low temperature, top panel; low to high, bottom panel) and temperature (black bars = 15 °C, white bars = 10 °C). Rather than a genuine effect of temperature or treatment order, this interaction appears to reflect a general decline in startle responses over time. Error bars show standard errors. Observation numbers in this figure indicate the absolute number of times each individual had been observed, rather than the number of observations that had taken place within a given temperature condition.

