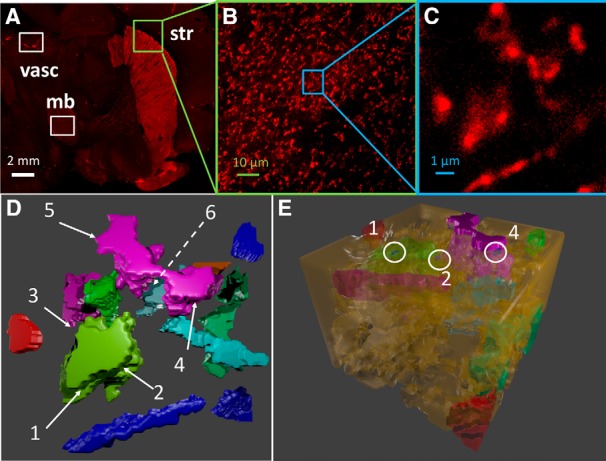
Figure 1.

Reconstruction of the morphology of DA neuronal axons. A, HA-DAT distribution in different regions of mouse brain including midbrain (mb) and striatum (str) acquired from sagittal slices. The slices were labeled with HA11 antibody detected with Cy3-conjugated Fab IgG fragments (HA, red). Nonspecific staining of vasculature (vasc) is also highlighted. White scale bar, 2 mm. B, Maximal-projection image of the first five (starting 10 μm deep from the edge of the slice) confocal sections of the 3D image from striatal region. The slice labels are same as those in A. Green scale bar, 10 μm. C, Maximal projection of the first five sections of 3D image of the small striatal region, used to construct the simulation environment (inset), magnified from B. Blue scale bar, 1 μm. D, 3D reconstruction of the region shown in C, visualized using CellBlender (Bartol et al., 2015b), an add-on for Blender 2.78 (http://www.blender.org). Different colors refer to 13 different axonal varicosities (DA terminals). The remaining portions are occupied by cells that do not express DAT. The location of six AZs are shown by the labels 1–6. The dashed line indicates an AZ that is not visible from this perspective. E, Full isometric view of the simulation box. White circles indicate the locations of three AZs.
