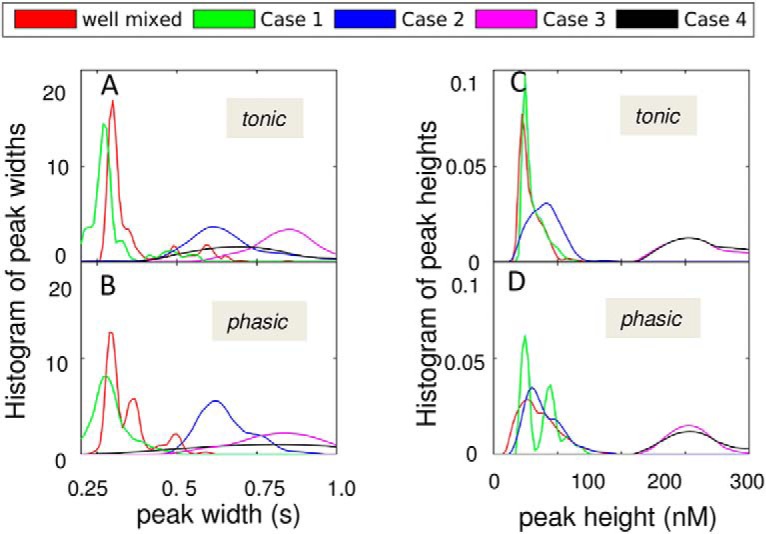
Figure 11.

Distribution of peak heights and widths for EC DA levels. Results are presented for four different types of DAT distribution on the plasma membrane, in addition to the well-mixed case. The curves are color-coded, as labeled. The probability distributions of peak widths (A and B) and peak heights (C and D) are presented for tonic (tonic) and phasic (bottom) firing patterns.
