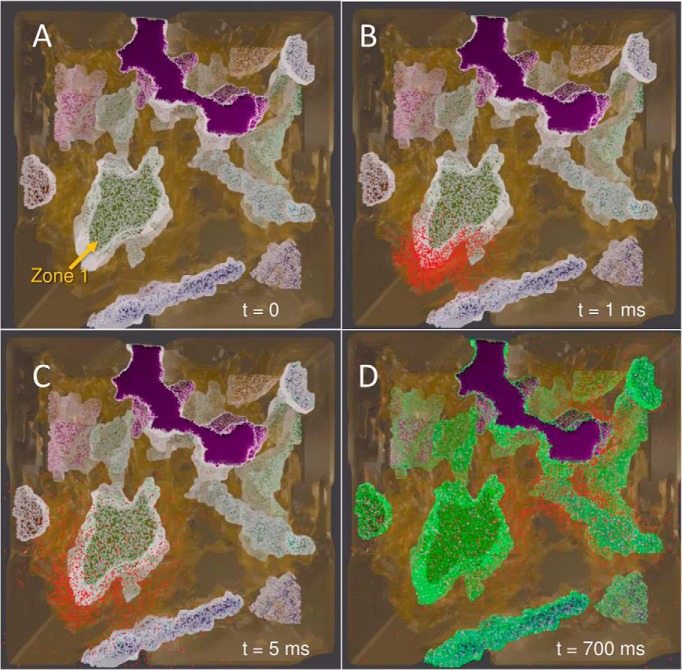
Figure 6.
Snapshots from MCell simulations of DA release and reuptake by DATs on DA terminals. Snapshots from an equilibration simulation of 1 s, initiated by a release event at t = 0, and followed by AP firings at 4-Hz frequency are displayed, visualized using Blender. Color code: red, DA; white, OF DAT; green, IF DAT. The purple region shows an axon terminal that is inactive during the simulations. Initially, all DATs are in the OF state (A). A release event at 1 ms is shown in B, and another at 5 ms (C), where most of the DATs reside in the OF state. DA molecules diffuse to extrasynaptic regions in <10 ms. D, The high population of DATs in the IF state reached at ∼700 ms.

